Hello. My name is Andy. I live in the Boston, Massachusetts area and I make maps. I spent many years building bespoke interactive maps with Axis Maps. These days I'm a cartographer for hireā€”get in touch if you need a map!

Buy prints of my maps

More links and resources...

My blog (personal projects)

Bostonography

Talks and tutorials

awoodruff@gmail.com

Atlas basketball

A globe? A basketball? Both.

Collaboration with Kirk Goldsberry

FlightAware Map Design

Consulting on data and designing vector tile styles for FlightAware's new map

Prints for sale

My modest online shop. More coming soon!

Eclipse 2024 map

A scrolling map following the path of the April 2024 eclipse across North America

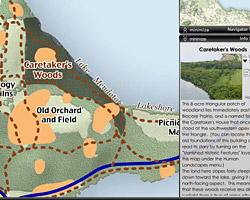
White Mountains "National Park" map

A map of the White Mountains in the style of US National Parks visitor maps

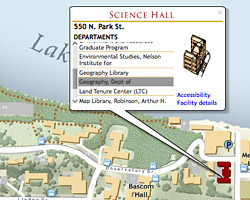
Leventhal Map Center Designer In Residence

Maps related to "urban atlases" made during my time as Designer-in-Residence with the Leventhal Map and Education Center

30 Day Map Challenge 2023

Some favorites from a month of making a map each day

Flowing terrain maps

Stylized, feathery terrain maps that seem to show flows through the landscape.

Daylight Saving Time maps

Interactive exploration of how Daylight Saving Time and time zones affect sunrise and sunset.

Healthy Places Index

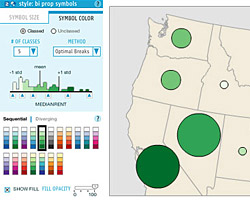
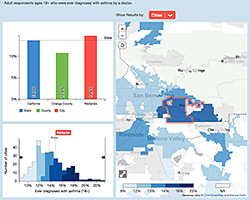
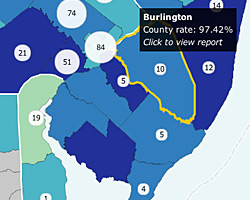
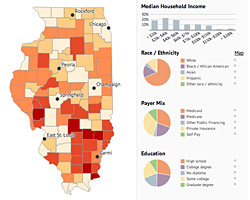
A public health atlas of California offering deep exploration of numerous health indicators and/or custom scores, at many levels of geography.

Team project with Axis Maps for the Public Health Alliance of Southern California

Typographic Maps

I started this series of detailed city maps made solely with type. Buy a poster or mug or something, won't you?

Solo project originally, then team business endeavor for Axis Maps

Bostonography

An ongoing collection and blog of occasional cartographic looks at life and land in the Boston area.

Collaboration with Tim Wallace

Beyond the Sea

What's really across the ocean when you look straight out? Straight lines on a round world don't always go where you might expect.

Beyond the Sea Interactive

An interactive version of the “Beyond the Sea” maps, showing straight-line paths across the oceans.

Contour map generator

A web map tool for generating, styling, and downloading elevation contours for anywhere in the world.

Solo project for Axis Maps. Read more about this project

“We Are One” touchscreen maps

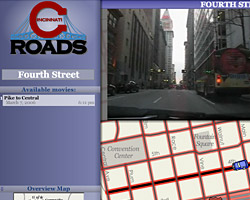
Touchscreen browsers for an exhibition of historic maps at the Boston Public Library. A web version is still online, with some features broken.

Team project with Axis Maps for the Norman B. Leventhal Map Center at the Boston Public Library.

Napa Valley Wineries Map

Explore Napa Valley Wineries and build a trip itinerary.

Team project with Axis Maps for Napa Valley Vintners. Read more about this project
ColorBrewer

ColorBrewer

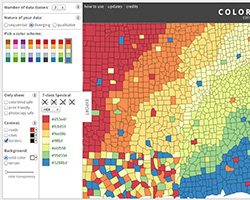
Cynthia Brewer's work on color schemes for maps. I built the current version of the interactive tool, which is maintained by Axis Maps.

>Eruptions, Earthquakes, and Emissions

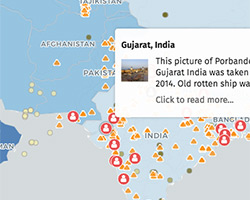
Eruptions, Earthquakes, & Emissions

An animated map (currently broken but not gone) of 250K earthquakes and volcanic eruptions since 1960, for the Smithsonian Museum of Natural History.

DIY Hillshade

DIY Hillshade

Working through how to render shaded relief with JavaScript.

>Rotavirus vaccine visualization

Rotavirus vaccine visualization

Animated, interactive map of uptake in rotavirus vaccines in the United States, from millions of weekly data points. Map seems gone but you can still read about the project.

East India Company trade visualization

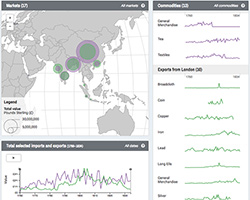
East India Company Visualization

Interactive maps and charts tell the history of commodities imported and exported by the East India Company.

Geography of Jobs

Geography of Jobs

Animated map of 15 years of job gains and losses.

Flowing terrain maps

Animated flowing terrain maps

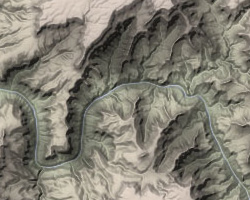
More experiments in canvas-based terrain mapping, finding and animating hypothetical drainage.

Sketchy relief maps

Sketchy relief maps

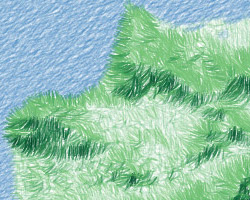
An attempt at hachure maps went off the rails but ended up being kind of pretty.

Jamaican Slave Revolt

Jamaican Slave Revolt Map

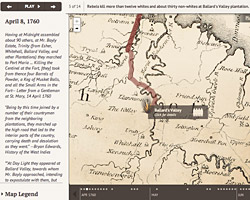
Animated interactive map of the slave rebellion in Jamaica of 1760–1761.
More

MBTA bus speed map

MBTA bus speed maps

Bus locations and speeds in the Boston area over time: live maps and 24 hour composites.

Crowdsourced neighborhood boundaries

Crowdsourced neighborhoods

Collecting and analyzing opinions on neighborhood boundaries in the Boston area.
More and Even more

Gas Leaks Map

Natural Gas Leaks Map

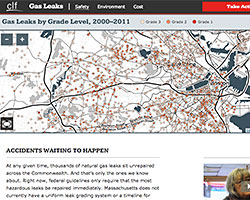
An interactive site explaining and highlighting natural gas infrastructure problems in Massachusetts.

Illinois Public Health Community Map

Illinois Public Health Map

Interactive map of Illinois public health data.

Global Commodities Prices

Global Commodity Prices

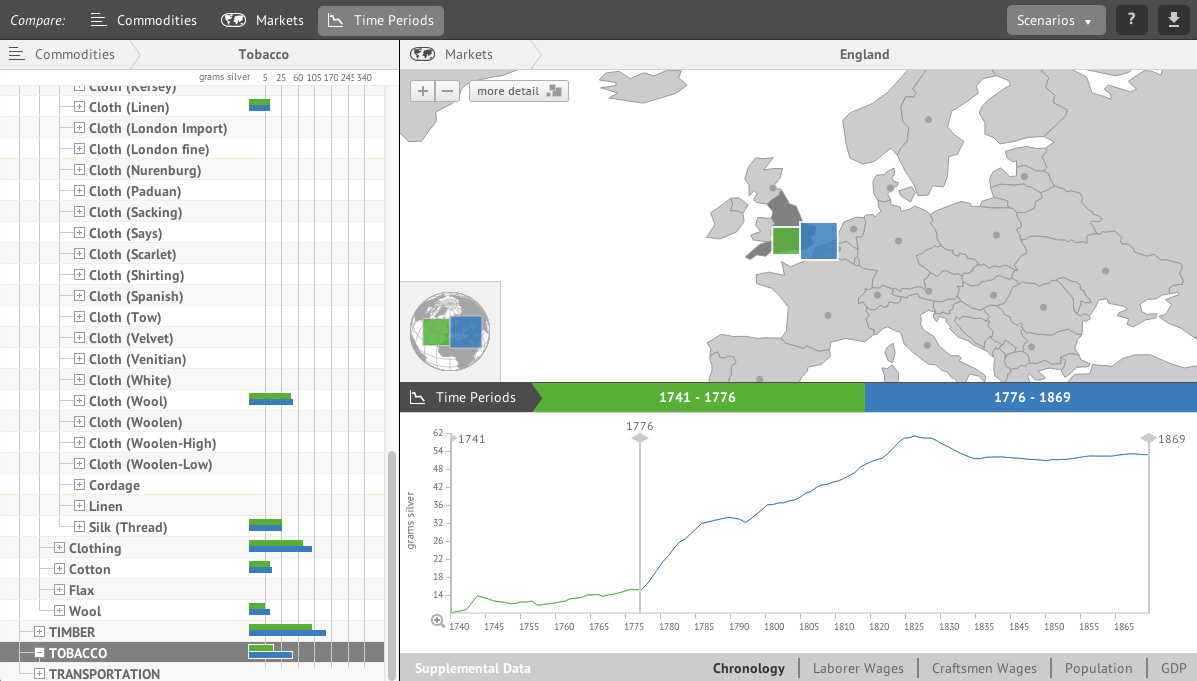
A visualization of prices for 400 commodities across 245 different markets and some 1000 years of history.

Hubway trip explorer

Hubway Trip Explorer

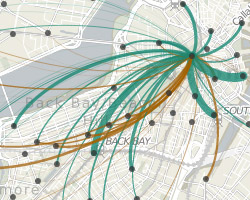
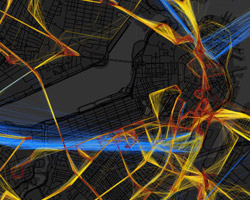
Kind of broken, but you can get an idea of what this did: View trip patterns to and from stations in Boston's Hubway bicycle-sharing program based on a variety of filters.

ideas

Boston Globe Features

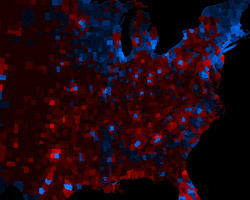
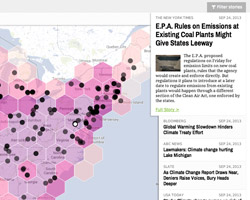
Five map features I've done for the wonderful Ideas section of the Boston Sunday Globe.

Boston's summer colors

Boston's Summer Colors

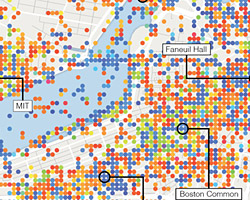
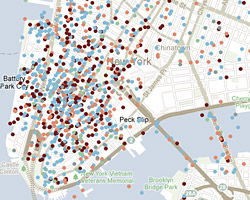
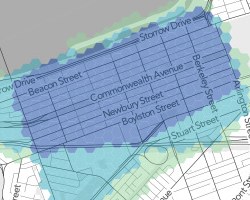
Dominant hues of some 50,000 geotagged photos in the central Boston area during summer months.

MAPC basemap

MAPC basemap

A general-purpose Massachusetts basemap for a regional planning agency.

Hubway trip explorer

Hubway Snapshots

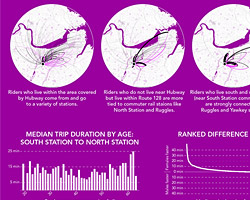
A few infographics to pluck out some interesting bits of information from the Hubway bike-share data.

Boston Squared

Boston Squared

A celebration of the unique shapes of Boston's so-called "squares."

Ohio is a Piano

Ohio is a Piano

88 counties, 88 keys on a standard piano. Data becomes music!

Cincinnati Subway

Cincinnati Subway

A cartographic overview of the abandoned Cincinnati subway project of the 1920s.

Molokai

Molokai shaded relief

Fun with shaded relief in Photoshop, based on Tom Patterson's old tutorials.

Graveyard

Alas, a portfolio of more than 15 years of work in online cartography means that many projects stop working (RIP Flash) or simply disappear. Everything below is gone but not forgotten!

indiemapper

indiemapper

The biggest dead link of all: a full-fledged web-based cartography app we made at Axis Maps. The link here is to an old blog post with an overview from when it launched.

nyt sept 11 map

NY Times September 11 Map

I worked with NYT Graphics to build a map where users could submit and view memories on the 10-year commemoration of 9/11.

NBA shot charts

Interactive NBA charts

The interactive charts I made are now gone from Kirk Goldsberry's Grantland article on top NBA shooters and scorers, but you can still read his article and use your imagination, I guess.

Cincinnati Roads

Cincinnati Roads

From the days before Google Maps: this was an interactive map viewer for dash-cam videos of Cincinnati streets.

2008 election map

2008 election map (the original "value-by-alpha")

My first experiment with what we later called a "value-by-alpha" map, as an alternative to election cartograms.

UW Online Campus Map

UW Online Campus Map

A prior version of the University of Wisconsin-Madison's web map. It's gone now, but I totally worked on it.

AskCHIS NE

AskCHIS NE

A dashboard map for exploring, comparing, and visualizing various California health estimates.

Lakeshore Nature Preserve

Lakeshore Nature Preserve Map

A rich interactive exploratory map of natural areas on UW-Madison's campus.

Global pollution map

Pollution.org

Global map of water/air quality, contaminated sites, pollution-linked deaths, and user-reported stories.

Why Not The Best?

"Why Not The Best?" Map

Interactive map showing quality-of-health-care data across various measures and scales in the US.

ClimateCommons map

Climate Commons

Aggregated news stories related to climate change in the US, alongside some pertinent geographic data.